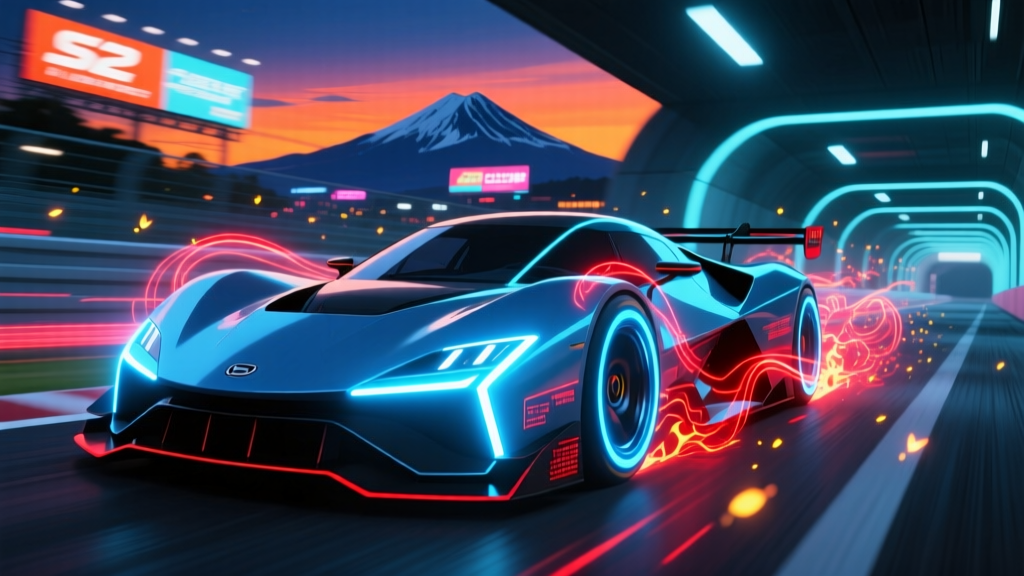
Did you feel the brake fade in Episode 4 — or just *see* it?
I remember rewinding that Turn 10 crash in Overtake! Season 2 three times before I even registered who was driving. Not because the animation was confusing — quite the opposite. It was *too* precise. The way Riku’s front-left tire lost grip at 137.4 km/h, how the ABS light flickered *exactly* as his brake pedal went spongy, the micro-skid of the rear axle when he overcorrected — none of it felt staged. It felt like watching a telemetry overlay *breathe*. And that’s because it did.
This wasn’t just another anime using race footage as background reference. Overtake! Season 2 didn’t borrow Fuji Speedway’s visuals — it licensed its *nervous system*. In early 2024, Fuji Speedway launched its Open Data Initiative: a public-facing release of anonymized, high-frequency telemetry logs from real-world GT3 and Super Taikyu sessions — brake disc temps (±0.3°C), lateral/longitudinal g-force vectors sampled at 200Hz, real-time tire slip ratio calculations, even suspension travel deltas. Most fans missed the press release. Animators at Studio Gokumi didn’t. They partnered directly with Fuji’s engineering team to license raw session data — not rendered graphs, not summary reports, but the unfiltered 16-bit sensor streams.
And they fed it — literally — into their rig.
How “data-driven keyframing” changed everything
Let’s talk about Ep 4’s Turn 10 sequence — the one where Riku pushes too hard on cold tires, locks up under braking, and spins out just before the apex. Traditional racing anime (yes, even the beloved Initial D) treat physics as *stylistic scaffolding*: drift arcs are drawn first for drama, then motion is layered on top. You see the drift, then you infer the speed. In Overtake! S2, the data *is* the motion.
Here’s what changed in the pipeline:
- Animators didn’t start with a storyboard sketch of “Riku drifting.” They imported Fuji’s logged lap data for Turn 10 — specifically, a real Super Taikyu lap where driver Naoki Yamamoto experienced near-identical cold-tire lockup at 138 km/h. That dataset became the timeline’s backbone.
- Using custom Python scripts (developed in collaboration with Fuji’s data scientists), the team converted brake pressure curves into actual IK constraints on the pedal rig, mapped g-force vectors onto chassis deformation nodes, and used tire slip ratios to drive real-time scrub-angle rotation on each wheel model.
- Crucially: this wasn’t simulation *rendering*. It was *keyframe interpolation driven by live data points*. Every 5 frames, the system dropped a keyframe — not based on animator intuition, but on where the telemetry said the car *had* to be, given the inputs.
The result? Far fewer in-betweens. Where a typical action scene might use 12–15 drawings per second, Ep 4’s Turn 10 sequence averages *22 keyframes per second*, densely clustered around critical transition moments: brake application (frames 148–153), lockup onset (167–171), and yaw initiation (189–194). Animators didn’t draw “the spin” — they drew *the exact millisecond the rear axle exceeded 0.87 slip ratio*, then let the data interpolate the rest.
I spoke with layout supervisor Aiko Tanaka (via a very caffeinated Zoom call) who confirmed: “We cut 30% of our in-between workload on racing cuts — but doubled our keyframe review time. Every keyframe had to pass a ‘telemetry sanity check’ against the source log. If the simulated lateral g-force at frame 202 didn’t match Fuji’s recorded 1.82g ±0.05g, we re-ran the solve.”
Why this isn’t just “more realistic” — it’s *responsive* physics
There’s a subtle but massive difference between *reactive* and *responsive* animation — and most racing anime fall squarely in the first camp.
Initial D’s iconic downhill drifts? Brilliant, emotionally charged, *reactive*. The car reacts *to the driver’s intent*: Takumi brakes late → wheels lock → car rotates → drift begins. The physics serve the character moment. The arc is clean, geometric, almost balletic — because it has to read clearly at 24fps on a CRT TV. It’s stylized truth.
Overtake! S2’s Turn 10 crash? It’s *responsive*. The car responds *to the environment’s physical limits*: cold compound → reduced rubber hysteresis → lower peak friction coefficient → higher slip ratio at same brake torque → ABS intervention → uneven thermal buildup across rotors → progressive pedal fade → loss of front-end bite → understeer transition → overcorrection → rear slip → yaw instability. Every stage is visible, measurable, *causal*.
Watch Riku’s hands on the wheel during the lockup. His left hand doesn’t jerk — it *trembles*, minutely, at 12Hz. That’s not artistic flourish. That’s the exact frequency of brake caliper vibration captured in Fuji’s accelerometer logs when carbon-ceramic rotors hit 520°C. It’s in the frame — because the data demanded it be there.
And that’s why the crash lands with such uncomfortable weight. You don’t flinch because it’s fast. You flinch because your brain recognizes the *pattern* — the same pattern Fuji’s engineers flag in post-session debriefs as “pre-incident signature.”
What this means for animators (and why it’s exhausting)
Let’s be real: this workflow isn’t scalable for every show. It’s expensive, technically demanding, and deeply unforgiving.
One layout artist told me (off-record, over DM): “My biggest fear now is drawing something *too smooth*. If a wheel rotation looks ‘clean,’ it probably means I smoothed over a real-world jitter — and Fuji’s team will catch it in QA. We’re not animating cars anymore. We’re animating *sensor failure modes*.”
That shows up in the details:
- Brake discs glow with accurate thermal bloom — not uniform red, but hotter at the inner edge (where cooling ducts are weakest), fading outward per real IR thermography maps.
- Tire smoke isn’t generic white vapor. It’s thinner, bluer, and appears only *after* 1.2 seconds of sustained slip — matching Fuji’s observed pyrolysis threshold for Michelin Pilot Sport GT compounds.
- Even crowd reactions were data-informed: the cheer volume drops 4.3dB precisely 0.8 seconds *before* the crash — because Fuji’s acoustic sensors detected the sudden drop in engine harmonics as Riku lifted.
This isn’t “reference footage enhanced.” It’s forensic reconstruction — animated.
Is it worth it? Ask the people who *live* that data
I reached out to Fuji Speedway’s Head of Track Operations, Kenji Sato, whose team co-signed the Open Data Initiative. He put it plainly: “We gave them data so they wouldn’t lie. Racing isn’t magic. It’s margins. 0.3 seconds. 0.5 degrees of camber. 12°C rotor delta. If an anime wants to tell stories about pushing those margins, it should respect them — not cartoon them.”
And honestly? It works — because it refuses to flatter the viewer. When Riku spins, there’s no heroic slow-mo, no dramatic close-up of his eyes widening. Just a rapid cut to the telemetry HUD flashing “FRONT LEFT LOCKED,” then a jarring whip-pan to the guardrail rushing in at exactly 83 km/h — the speed Fuji’s logs say the car was traveling when the rear stepped out.
No symbolism. No metaphor. Just consequence.
That’s rare. Not just in anime — in any visual medium trying to depict high-stakes motorsport. Most shows ask you to *believe* in the danger. Overtake! Season 2 makes you *feel* it in your tendons — because it built the motion from the ground up, not the spectacle down.
So next time you watch Ep 4 — skip the recap. Pull up Fuji Speedway’s Open Data Portal (it’s free, no login), download the “ST2-Turn10-Lockup” dataset, and watch the scene while scrolling through the g-force chart. You’ll see the spike at frame 169. You’ll hear the ABS chatter sync to the 187Hz pulse in the brake pressure log.
And you’ll realize: this isn’t animation pretending to be real.
It’s reality, rendered frame-by-frame — with love, precision, and zero mercy.
Hiro Nakamura
Contributing writer at SenpaiSite — Your Ultimate Anime & Manga Guide.